
The Financial Digital Twin for Biogas
We model biogas biology and economics together and see where performance becomes profit.
UNLOCKED, PER PLANT, PER YEAR
€1.1M
Typical 100 GWh plant. Disruptions are flagged 24- 72 h before sensor thresholds detect them.
Trusted by Industry Leaders


The €1M Monday
One Feedstock Surprise. One Offline Event.
Hour 0: A feedstock supplier substitutes an organic stream without notice.
Hour 72: VFA climbs, and methane composition drifts, usually invisible to threshold alarms. The upgrader trips.
14 days down: Up to €1M down.
Lost biomethane revenue
€308K
Missed volume penalty
€30–60K
Feedstock diverted to landfill
50K
CI revenue loss in the next year
€100–300K
€1M
What a plant does and what it can potentially do is the gap that we focus on.
WHO IS THIS FOR
Three Experts, One Number
MULTI-SITE OPERATORS
Single to multi-site operations benchmarked on one platform
CFO & LENDERS
Production data priced as a bankable asset.
PLANT ENGINEERS
VFA, FOS/TAC and ammonia level disruptions flagged 24–72h early.
THE REAL PROBLEM
What's visible doesn't connect to the money
OEM DASHBOARDS
Watch the equipment, give no view of the money.
MANUAL ENTRY
Retrospective — rich data stays trapped until assessed.
EXCEL SHEET
Financials buried, no live link to biology, no cross-site benchmark.
Digitalization without financial analysis is just unutilized data
THE ANESSA SOLUTION
Not a SCADA or CMMS Replacement
Most biogas software stops at collecting data for interpretation. Some go a step further and connect that data to the underlying biology of the digestion process.
We go one step beyond both.
Every data point we collect and every biological insight we surface is directly connected to its worth in revenue gained, cost reduced, or risk avoided.
Anessa Suite directly impacts your bottom line with stable operations, increased production and high EBITDA.
Anessa is the analytics and economics layer on top of the systems you already run. We help operators see what their assets are worth before it shows up in the financials.
Turning Biogas Biology Into Business Performance
Every 1% of lost annual production costs ≈ €100,000 on a typical plant.
We have identified the pattern in the biogas industry with hundreds of data points confirming the same issue.
1 → 40
single sites to multi-plant fleets
100s
of biogas plants across the world modelled
16
Countries
Wind & Solar Energy Faced the Same Struggle
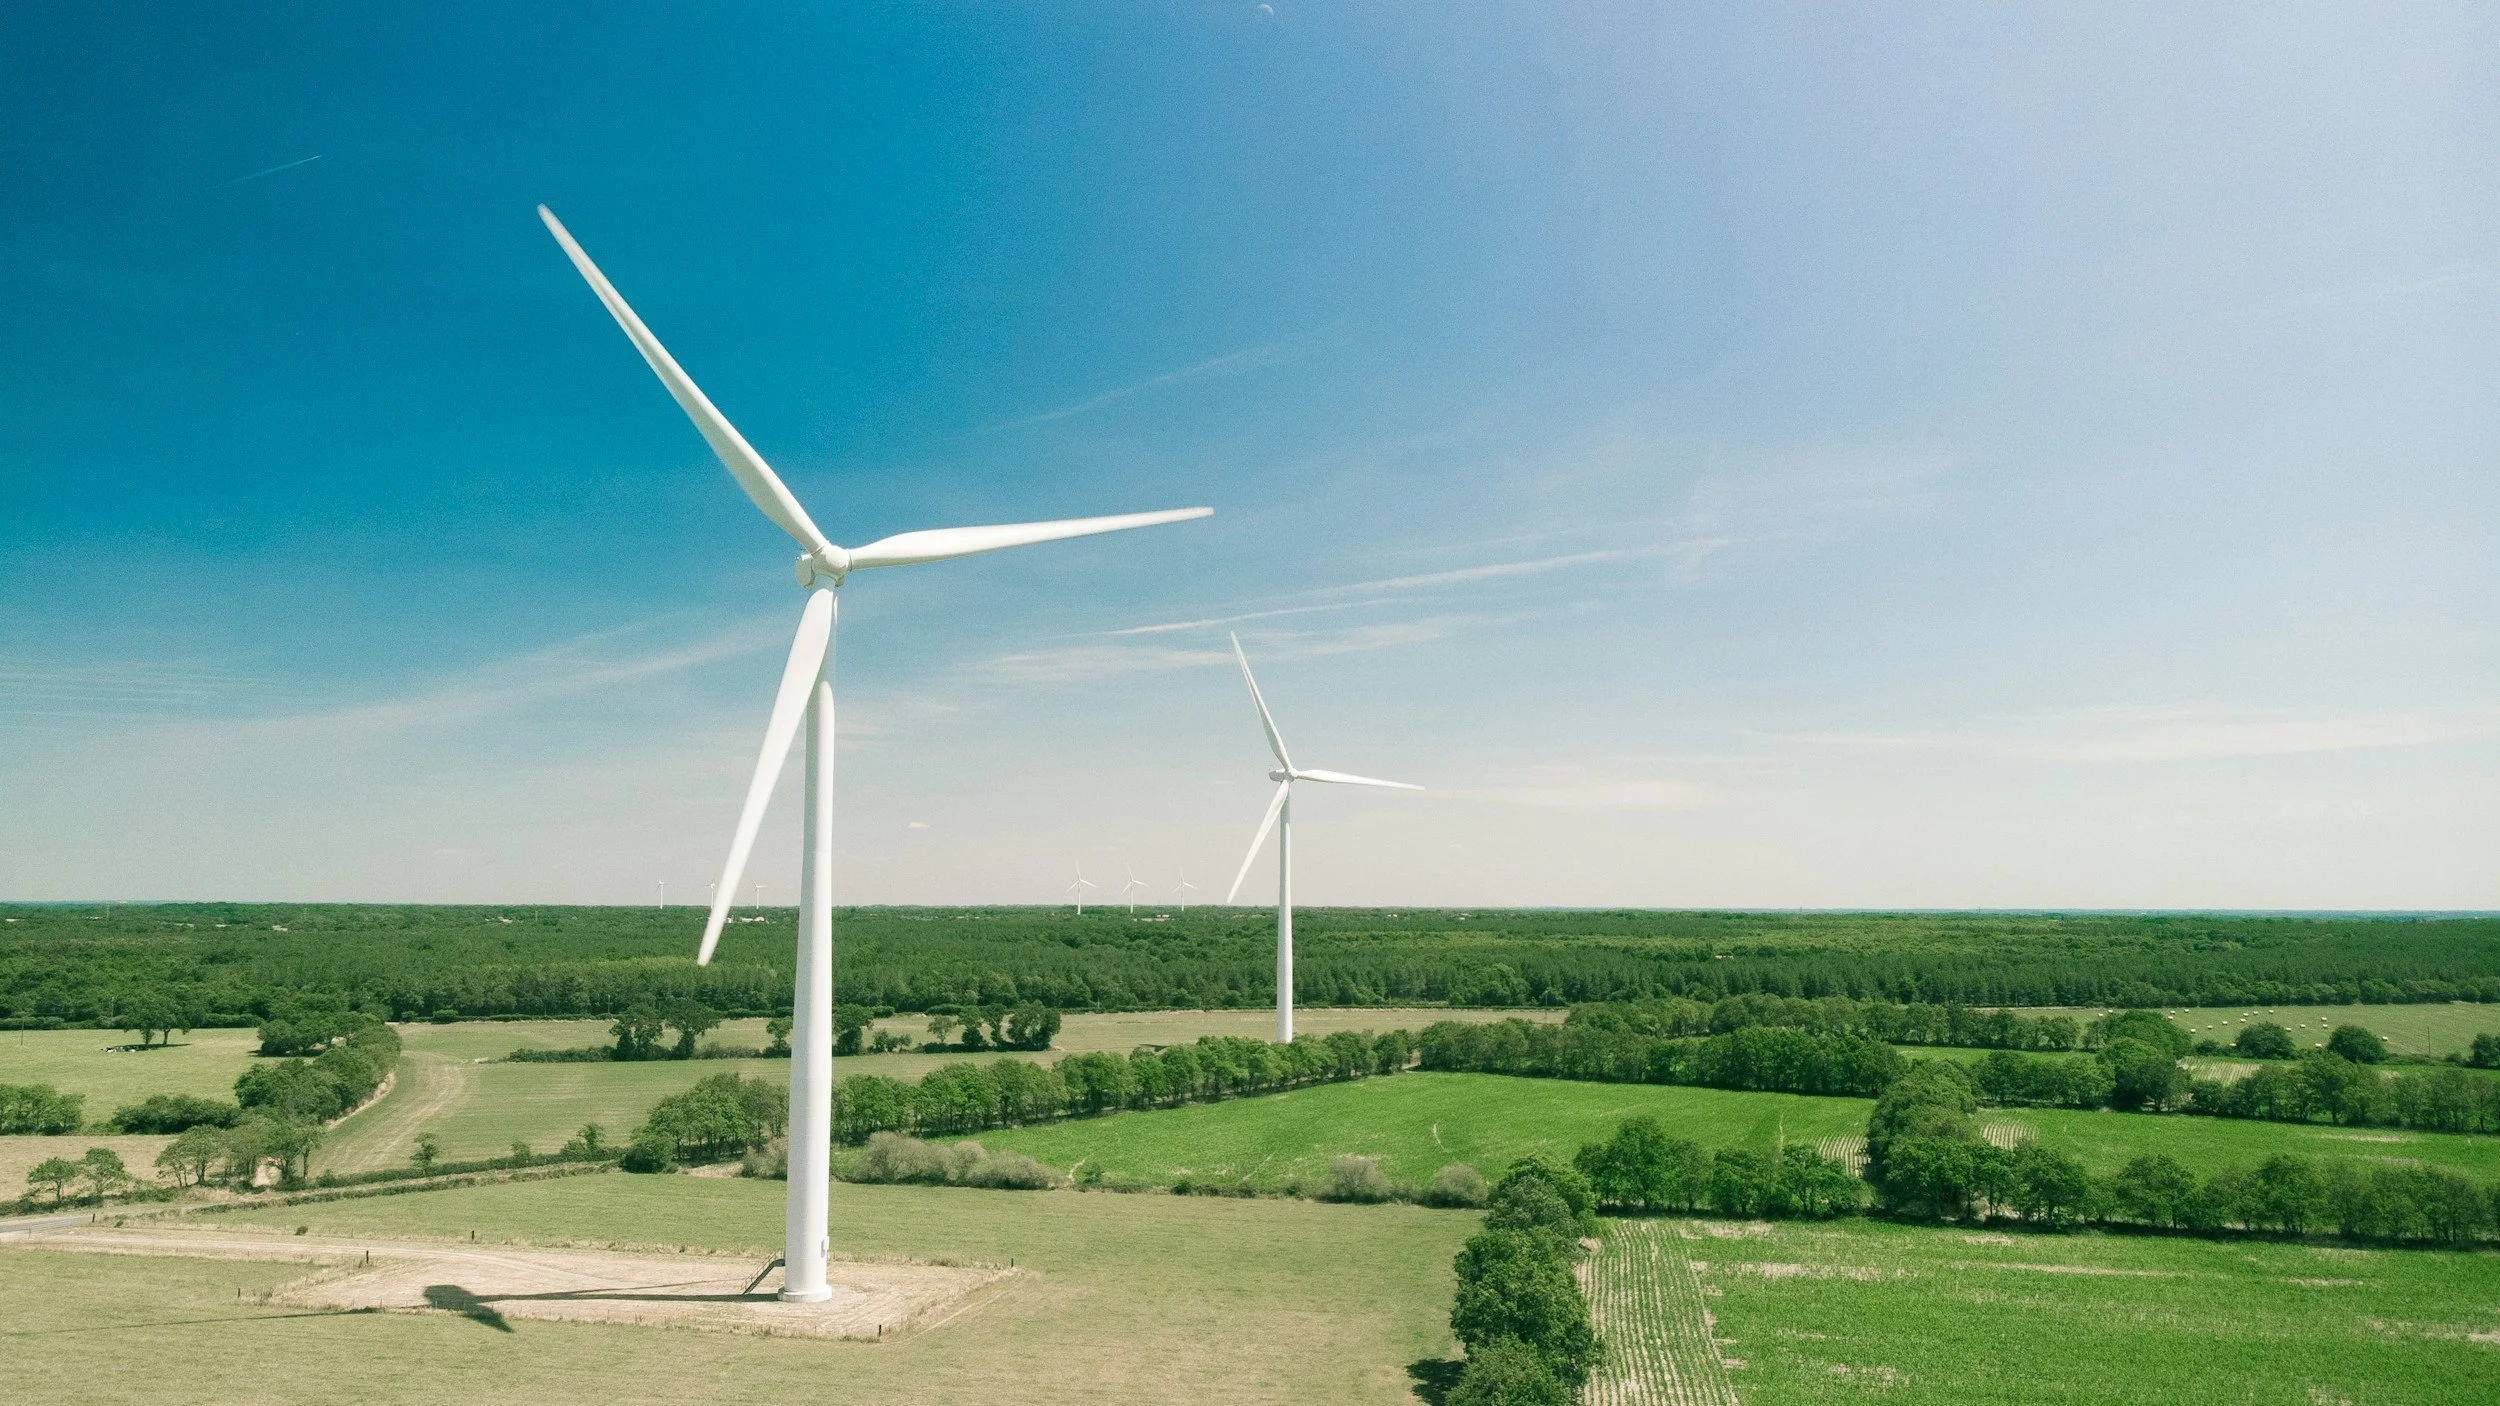
Wind
2005 - 2012
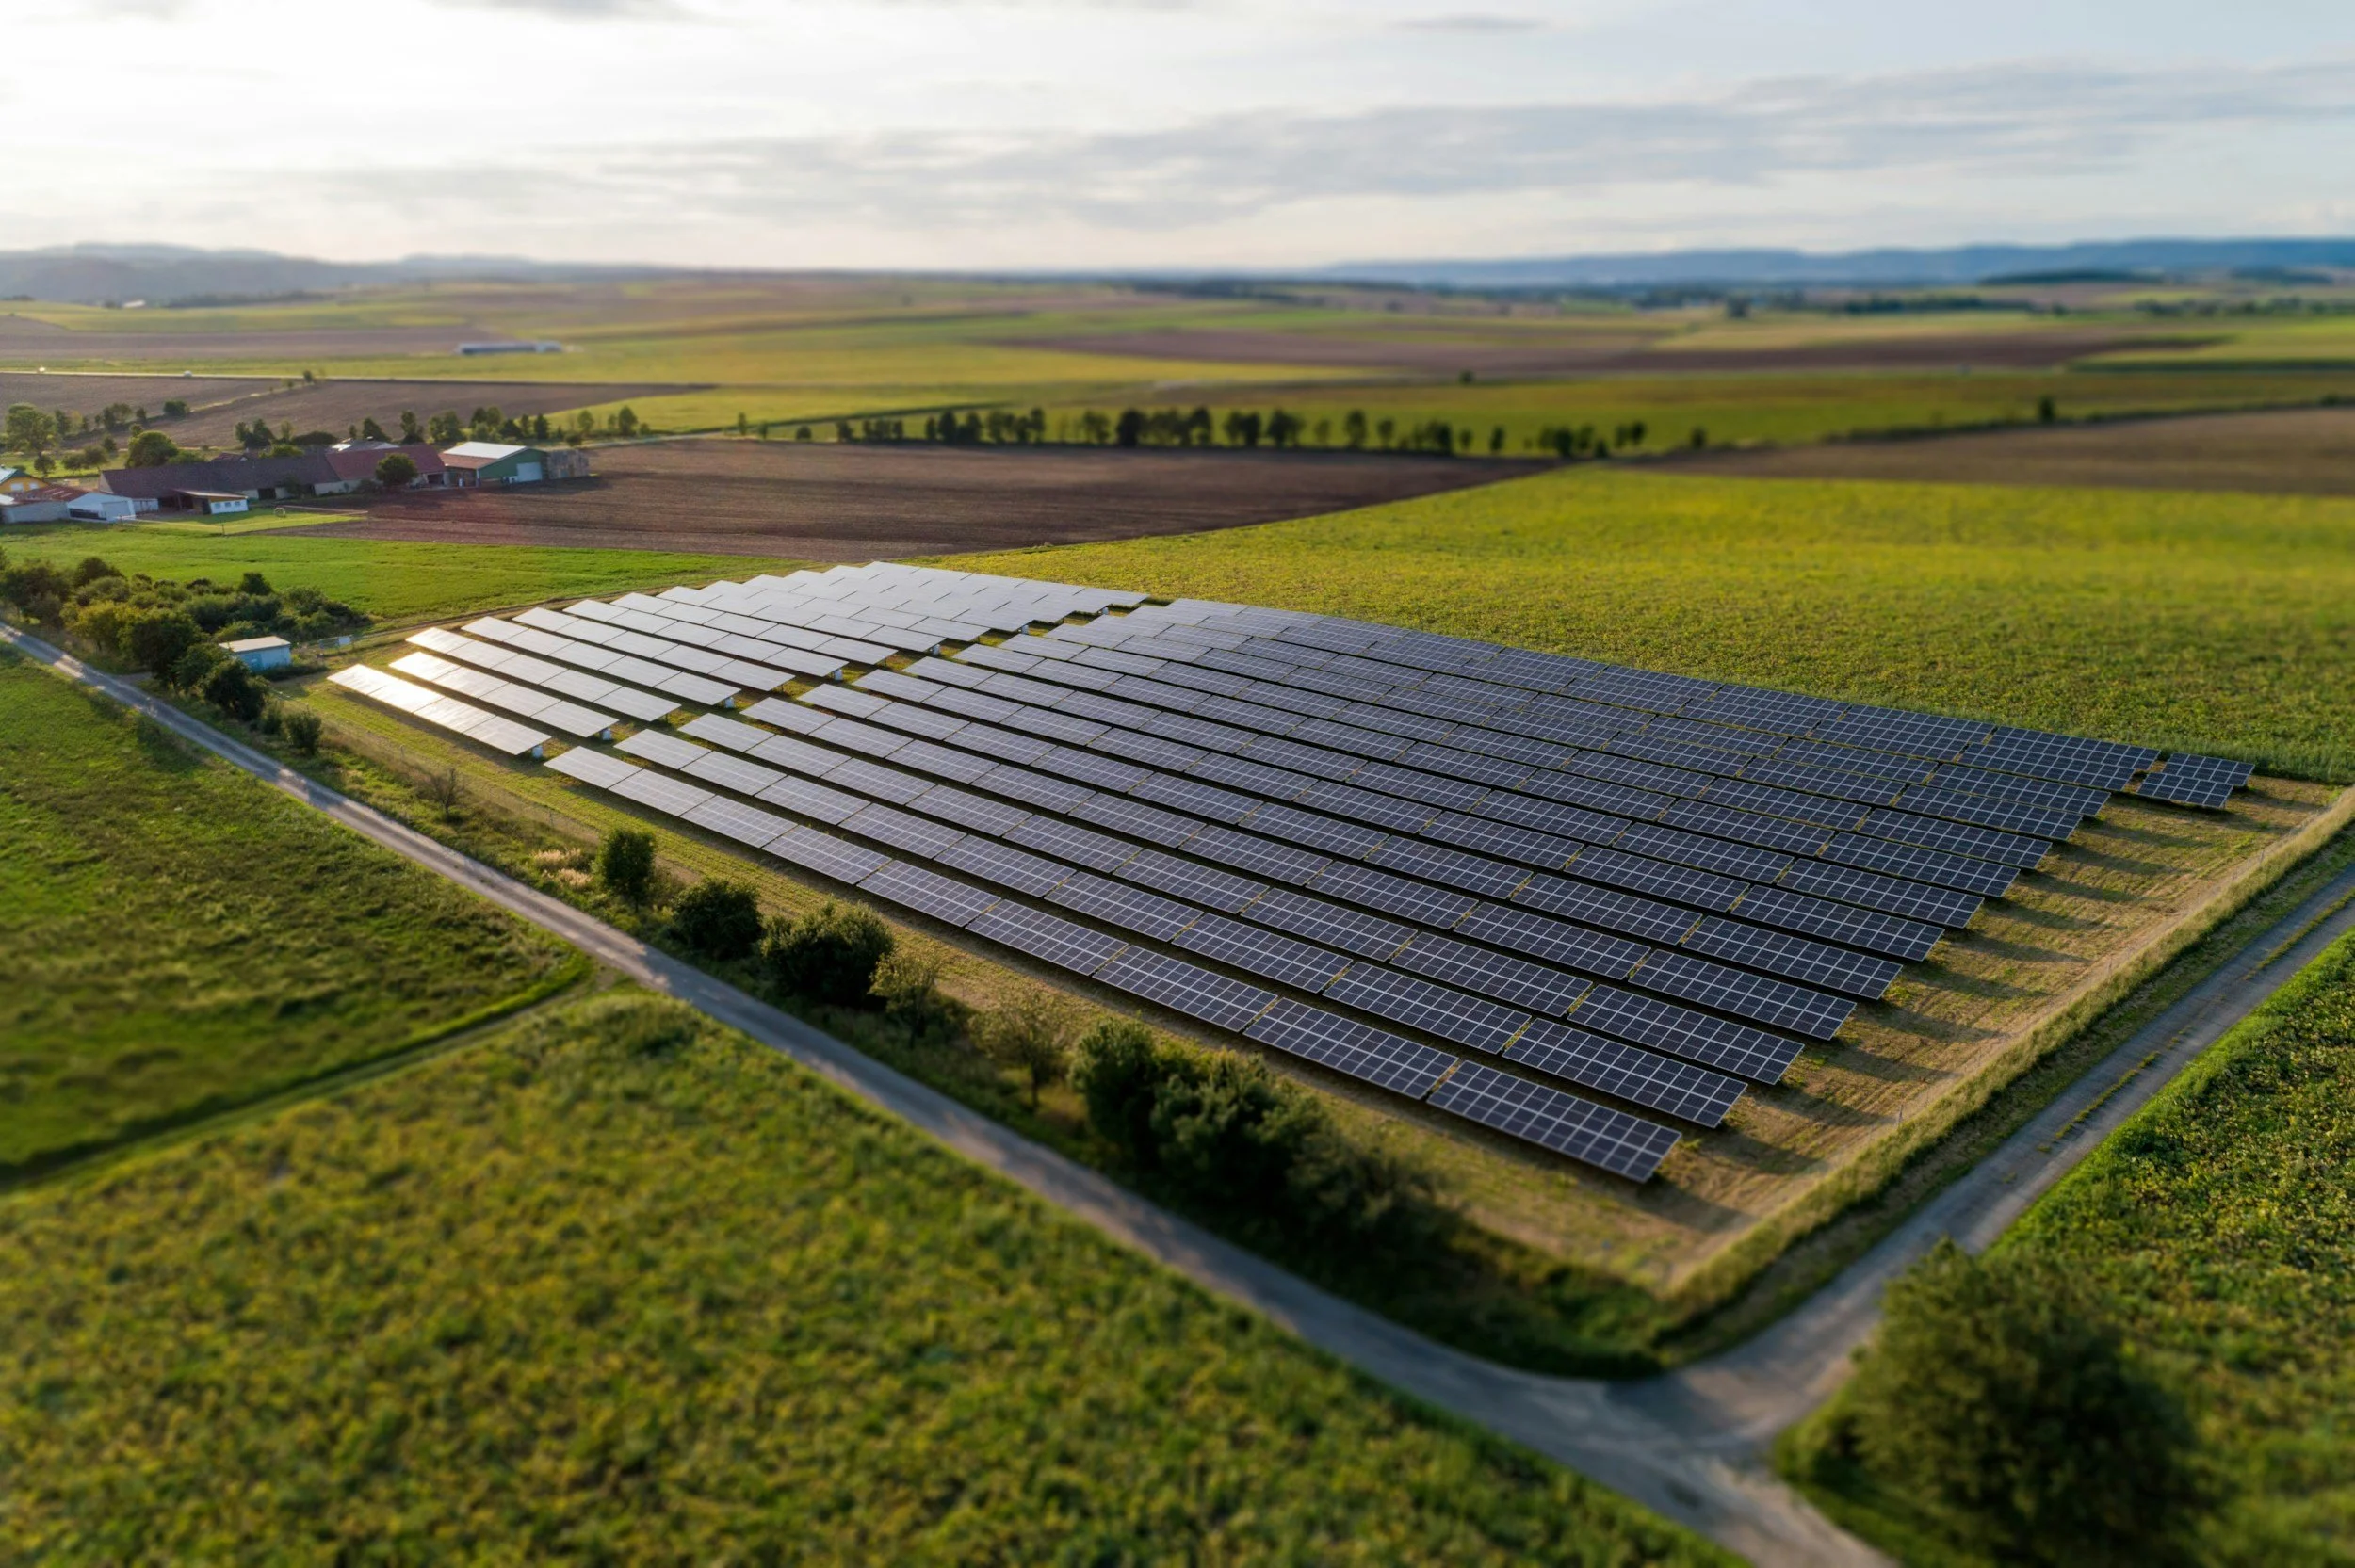
Solar
2012 - 2018
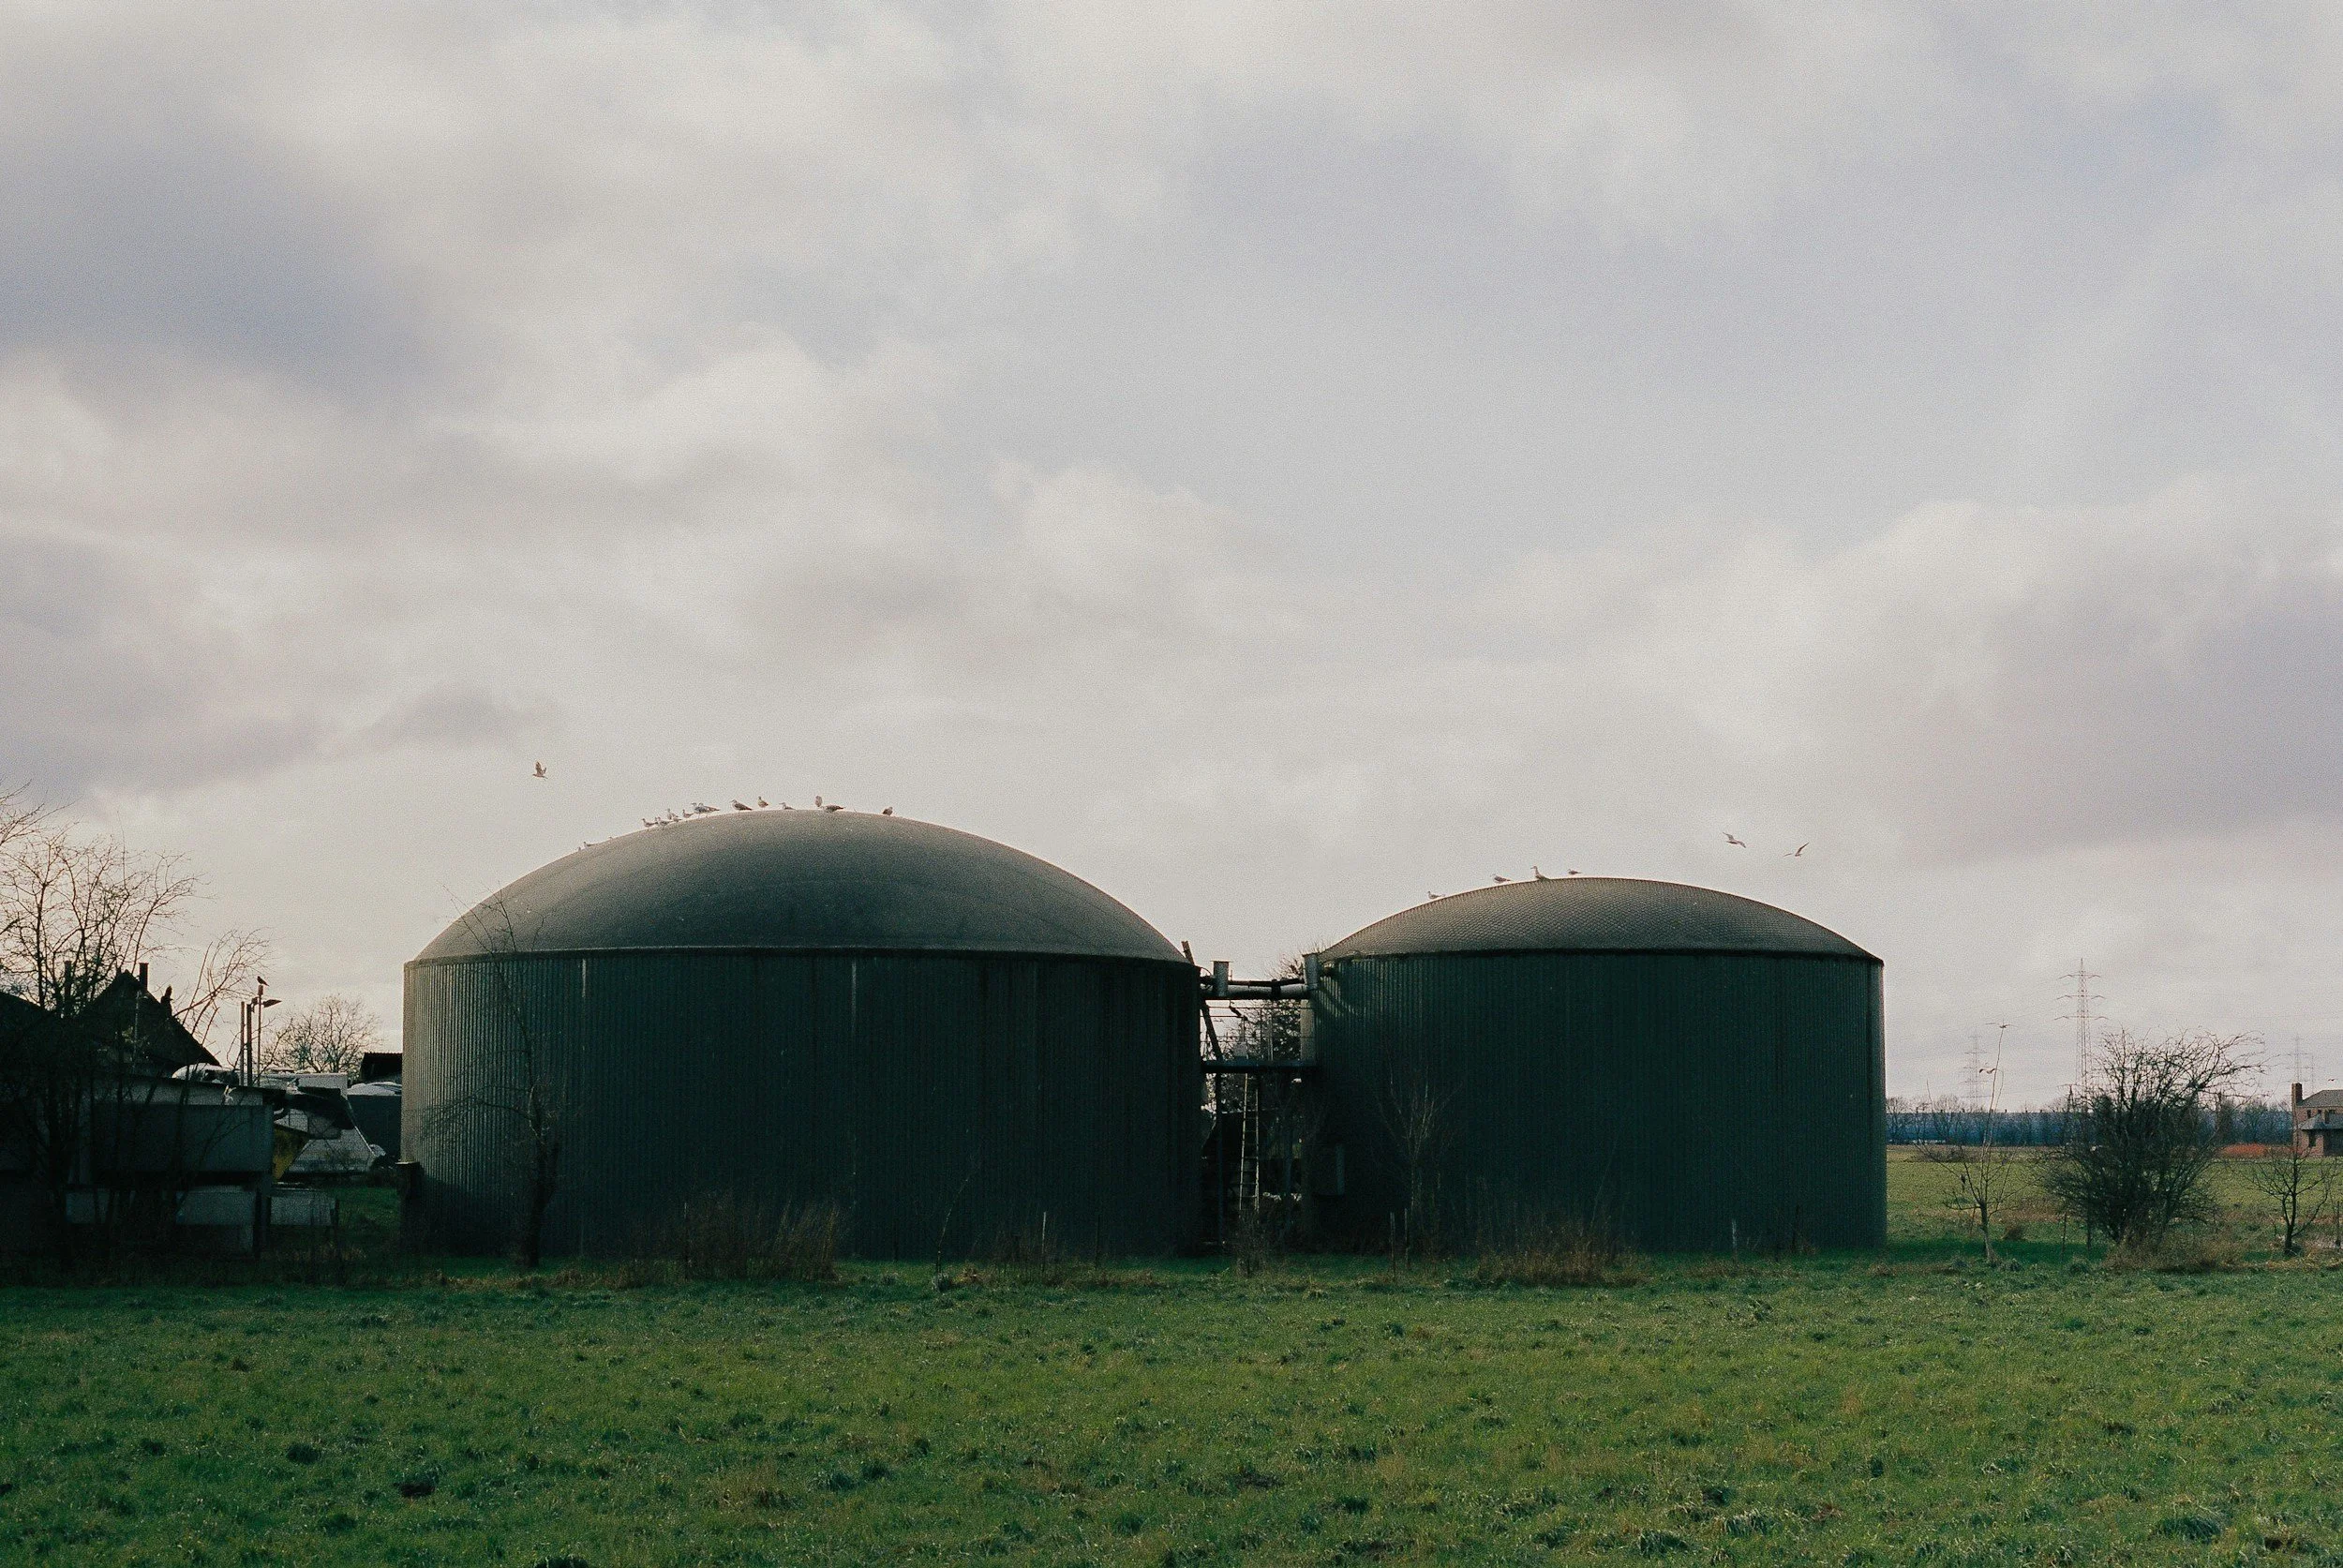
Biogas is where wind was in 2008, slowly achieving financial success
Both got there by adding an analytics layer that translated production data into financial confidence.
Every owner wants the same three things:
Don't lose money on preventable events
Make money running the plant better;
Make enough money that lenders price the asset as bankable.
Subscribe to our Newsletter!
Keep up with how Anessa is transforming the biogas industry.